The coldest weather in two years (or more depending on how you want to characterize it) has descended on the Northeastern United States. Temperatures were within shouting distance of zero in all of Southeastern New England Thursday morning, with wind chills running 5 to 15 degrees below zero. The high temperature on Wednesday afternoon did not make it out of the teens, and the same was expected in most spots on Thursday afternoon. Thursday night will not be any warmer, with temperatures forecast to nosedive back to the single digits, and possibly touch zero in some spots where the wind dies completely. The cold weather comes as a shock to the system of Southern New Englanders that had been enjoying a very mild winter, with the temperature averaging about 5 degrees warmer than normal from December 1 to January 20 before the cold snap hit.
While the cold is a slap in the face, it is not even close to unprecedented, and you don’t have to flip back too many years through the record books to find far worse. After looking back through the January weather records for the past decade at TF Green, we came up with some interesting observations.
- The temperature from Tuesday to Friday is likely to average about 15° colder than normal in Providence. It will be the coldest four-day stretch since January 21-24, 2005 – during which the second biggest Providence snowstorm on record (23.4″) happened in the middle of that cold snap.
- Providence has not come close to setting a record low minimum temperature during the cold snap. Record lows range from -9 to -13 between January 22-24, with the “warmest” record low -3 on January 25. The wind would have to die completely for TF Green to fall to near 0 by dawn Friday. That record is likely to survive another year, too.
- While the low temperature has been a far cry from the records, the high temperature of 16 on Wednesday was only 6 degrees off the record low maximum temperature for the date.
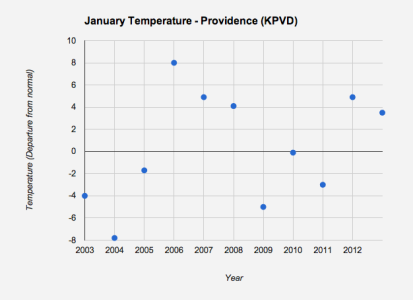
- January has been a very volatile month temperature-wise in the past decade in Southern New England. Some years have been extremely warm (2006, 2007, 2012) while others have been brutally cold by any standard (2003, 2004, 2009)
- You may have forgotten, but January 2004 was historically cold – the seventh coldest on record in Providence. Look at the numbers below – there was not a single warmer than normal day after January 5! That is a remarkable stretch considering what we’ve become accustomed to lately in the winter in Southern New England.
- In addition to being volatile, January has also been colder than normal more frequently than any other month in the past 11 years in the Providence area – 6 of the past 10 years have been relatively cold. This year, because of a very mild start, it will most likely be slightly warmer than normal.
JAN-04 FOR PROVIDENCE, RI (62')                     LAT=41.7N LON= 71.4W

                 TEMPERATURE                       PRECIPITATION
          ACTUAL           NORMAL
        HI   LO  AVG     HI   LO  AVG   DEPT     AMNT   SNOW SNCVR   HDD
 1      45   33   39     38   22   30     +9     0.00    0.0    0     26
 2      37   26   32     38   22   30     +2     0.14    1.4    0     33
 3      50   35   43     38   22   30    +13     0.09    0.0    0     22
 4      52   38   45     38   21   30    +15     0.26    0.0    0     20
 5      38   34   36     38   21   30     +6     0.46    0.0    0     29
 6      37   20   29     38   21   29     +0    trace    0.3    0     36
 7      25   17   21     37   21   29     -8     0.00    0.0    0     44
 8      24   15   20     37   21   29     -9    trace  trace    0     45
 9      16    2    9     37   21   29    -20     0.00    0.0    0     56
10      16   -1    8     37   21   29    -21     0.00    0.0    0     57
11      27    2   15     37   21   29    -14     0.00    0.0    0     50
12      33   25   29     37   21   29     +0     0.08    1.4    1     36
13      43   13   28     37   21   29     -1    trace  trace    1     37
14      13    1    7     37   21   29    -22    trace  trace    0     58
15      12   -5    4     37   21   29    -25     0.03    1.3    1     61
16      13   -6    4     37   21   29    -25     0.00    0.0    0     61
17      38   12   25     37   21   29     -4     0.00    0.0    0     40
18      34   27   31     37   21   29     +2     0.20    2.9    2     34
19      27   17   22     37   21   29     -7     0.00    0.0    2     43
20      25    9   17     37   21   29    -12     0.00    0.0    1     48
21      29   13   21     37   21   29     -8     0.00    0.0    1     44
22      36   13   25     37   21   29     -4    trace  trace    1     40
23      22   11   17     37   21   29    -12     0.00    0.0    1     48
24      20    5   13     37   21   29    -16     0.00    0.0    1     52
25      18    1   10     37   21   29    -19     0.00    0.0    0     55
26      21    8   15     38   21   29    -14     0.00    0.0    0     50
27      25   15   20     38   21   29     -9    trace  trace    0     45
28      28   19   24     38   21   29     -5     0.25    4.0    0     41
29      27   17   22     38   21   30     -8     0.00    0.0    3     43
30      26   12   19     38   21   30    -11     0.00    0.0    0     46
31      27   13   20     38   22   30    -10     0.00    0.0    0     45

                     TOTALS FOR PVD
HIGHEST TEMPERATURE   52         TOTAL PRECIP        1.51
LOWEST TEMPERATURE    -6         TOTAL SNOWFALL      11.3
AVERAGE TEMPERATURE 21.4         NORMAL PRECIP       3.86
DEPARTURE FROM NORM -7.8         % OF NORMAL PRECIP    39
HEATING DEGREE DAYS 1345
NORMAL DEGREE DAYS  1109
